
Chapter 99 of 227 · The Theory of Interest by Irving Fisher
§3. The Market Line
Assuming that the individual's incomes for all other years remain unchanged, we shall now study the effects, for this one man, of changing the income amounts of the two years pictured. These changes are assumed to be caused wholly by trading some of his income of one year for some of another man's income for the other year. Except for such trading, his income situation is supposed to be fixed. He has, let us suppose, a rigid allowance of $1000 for this year and $1200 for next year with no opportunity to change these figures except by swapping some of one year's income for some of another's.
Suppose, for instance, that at a rate of interest of 10 per cent the individual borrows $100 in 1930 in return for $110 which he is to pay back in 1931. In Chart 23, such changes would be represented by lengthening the 1930 vertical line from $1000 to $1100 and by shrinking the 1931 vertical line from $1200, not to $1100 but to $1090. In Chart 25 these changes are represented by shifting the income position from P1, the originally fixed income position, to M1, whose longitude is $100 more and latitude $110 less.
If, as shown in Chart 26, the individual borrows a second $100, promising to repay $110, his income position Edition: current; Page: [236] shifts again, this time from M1' to M1'', that is, from this-year-1100-and-next-year-1090 to this-year-1200-and-next-year-980. Borrowing a third $100 would bring him to M1''', (this-year-1300-and-next-year-870). Every additional borrowing of $100 adds $100 to this year's income and subtracts $110 from next year's income. Chart 26 pictures these successive changes as a "staircase" of which each "tread" is $100 and each "riser" is $110. The stairs are steep. So long as there exists a rate of interest their descent is necessarily always faster than 45 degrees—that is, future income decreases faster than present income increases; the riser is more than 100 per cent of the tread—more by the rate of interest.2
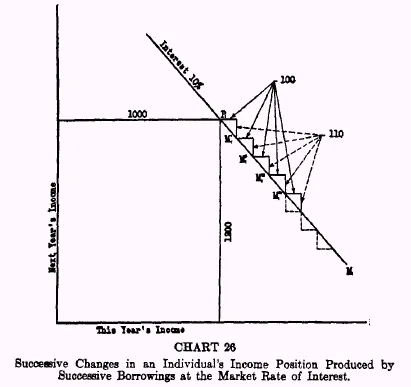
If the rate of interest were zero, each $100 borrowed would require only $100 to be returned next year. The riser would equal the tread; the Market line would make an angle of 45° with the axis, and its slope would equal unity, or, in other words, 100 per cent. Thus in this new method of charting, a given rate of interest is represented by the algebraic difference between the slope of the given Market line, and the 100 per cent slope of the 45° zero interest line.
Edition: current; Page: [238]Evidently the line P1M1 is a straight line. It may be called the Market line, Loan line, or Rate of Interest line, and, if prolonged, will contain all the positions to which this particular individual (who may be called Individual 1) can shift his income position by borrowing or lending.
If, starting at P1, he shifts down this straight staircase (southeast) he is a borrower or a seller of next year's income, because he is adding to this year's income and subtracting from next year's. If, instead, he shifts up the staircase (northwest) he is a lender or buyer of next year's income, subtracting from this year's income and adding to next.
The Theory of Interest
Read the whole book online · Book details
Free to read online and to download from this archive.