
Chapter 183 of 227 · The Theory of Interest by Irving Fisher
§4. Money Interest and Real Interest
The foregoing comparisons relate to simultaneous rates of interest in two contrasted monetary standards each actually used for loan contracts. We now turn to a comparison between money rates and real rates of interest, mentioned in Chapter II. Unfortunately no contracts in terms of real or commodity standards are available for quotation. All we can do is to note the changes in the Edition: current; Page: [408] price level, translate the actual rates in terms of money into real rates, and compare successive periods. Such comparisons are not very satisfactory, since no two periods, not even successive periods, are so alike industrially that we can say that they differ only as to the state of the monetary standard as reflected in the index numbers of prices. Of course, influences other than changes in money affect interest rates.
Detailed tables showing the average annual rate of change in the commodity price level,52 the rates of money interest, and the rates of real interest for London, New York, Berlin, Paris, Calcutta, and Tokyo are given in basic tables in the Appendix to this chapter. Wholesale commodity prices were used in computing these rates although cost of living indexes would have been preferable for this purpose and more in harmony with my theory of income. But cost of living indexes do not exist for the period covered.
Chart 42 shows the annual rate of change in the commodity price level (upper part) compared with the market rates of interest (lower part) in the London market over the period 1825 to 1927. The chart also gives the real rate by a dotted line, but this may, for the present, be overlooked.
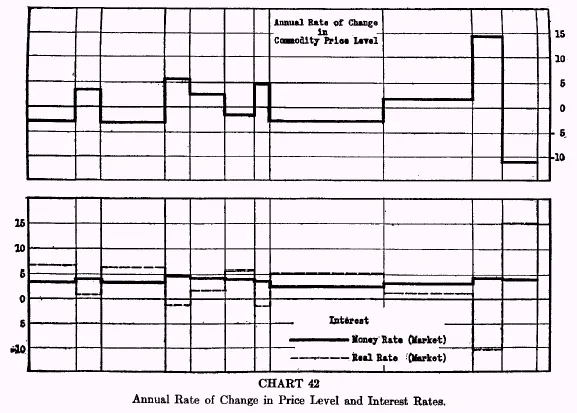
It will be observed that the entire period is broken up into sub-periods, which conform to rather definite and successively contrasted price movements. These sub-periods were allowed to choose themselves, so to say. That is, they were so chosen that each period should show a rather distinct change in the rate of price change as compared with the preceding and succeeding periods. Edition: current; Page: [409]Edition: current; Page: [410] The periods were not chosen with any reference to, or indeed with any knowledge of, how the choice would affect the comparisons to be made. For example, the period 1825-1834 was a period during which commodities at wholesale fell at the average (annual) rate of 3.0 per cent per annum; this is plotted on the chart, in the usual way, by a horizontal line 3.0 points below the zero line. In the period 1834-1839 prices rose at the rate of 3.3 per cent per annum; this is plotted on the chart by a horizontal line 3.3 points above the zero line.
A brief glance at Chart 42 reveals that when the rate of price change falls from one period to the next, the money rate of interest usually falls, and when the rate of price change rises, the interest rate usually rises also. The comparison of each period with the one following may be designated as a sequence. In London eight such sequences out of ten for bank rates, and nine out of ten for market rates support the theory that money interest rates move in the same direction as the price level.
Comparisons of price change rates and interest rates have also been made for New York, Berlin, Paris, Calcutta, and Tokyo. The results, favorable and unfavorable, of all these comparisons are summarized in Table 13.
| TABLE 13 Sequences, Favorable and Unfavorable | |||||||
|---|---|---|---|---|---|---|---|
| London | Berlin | Paris | N. Y. | Calcutta | Tokyo | Total | |
| Favorable | 17 | 10 | 0 | 4 | 6 | 1 | 38 |
| Unfavorable | 3 | 2 | 1 | 3 | 3 | 3 | 15 |
Of the sequences compared, 38 support and 15 oppose the theory propounded. Thus, the favorable sequences are two and a half times as numerous as the unfavorable Edition: current; Page: [411] sequences. This is a large preponderance, especially when we consider that there are so many inexactnesses in the statistical data and so many other causes affecting the rate of interest besides changes in the price level.
The same result may be expressed in terms of correlation coefficients. When we correlate interest rates with price changes for the important industrial countries (England, Germany, United States), fairly high coefficients (about +0.7) are obtained. Correlating the first differences, that is, changes in interest rates and rates of price changes, likewise, shows a fairly high relationship in accord with the theory. However, the correlation for the data of all countries combined is insignificant. For all the countries studied we find +.036; for the corresponding first differences, -.165. It is seen that the well defined movements of prices and interest in the principal countries are largely offset by the movements in the countries of lesser economic importance. To obtain more decisive evidence upon the relationship studied, it is necessary to resort to the more rigorous analysis given in subsequent sections.
The evidence obtained from the comparisons in this section indicate that there is a very apparent, though feeble, tendency for the interest rate to be high when prices are rising, and the reverse. The adjustment is imperfect and rather irregular, but in the great majority of cases the tendency is evident.
The Theory of Interest
Read the whole book online · Book details
Free to read online and to download from this archive.