
Chapter 188 of 227 · The Theory of Interest by Irving Fisher
§9. Elimination of Trends
These high correlations do not necessarily mean that the interest rate will always be high when prices are high and low when prices are low, but the tendency toward this is definitely established.
The correlations obtained for all periods and sub-periods considered are unusually high. It is necessary to guard against the possibility that these coefficients are of the familiar nonsense type, and are spuriously high because of the presence of secular trend forces that affect both P and i. Due consideration was given to the control devices that have wide acceptance in the literature of statistics, such as "elimination of trend" and "seasonal" fluctuations. The general methodology of analysis of time series is still in the process of formulation. The specific problem of trend analysis is still largely unsolved.60 In the present case, it is rather doubtful that trend forces are involved which should be eliminated. What is desired in Edition: current; Page: [432] all the preceding comparisons of price levels and interest rates is to discover what precise relation obtains between interest rates and prices in the long run. It is like giving the play of Hamlet without Hamlet to eliminate the secular trends of i and P from a study of long term relationships in which these very secular trends are most important and often dominant influences.
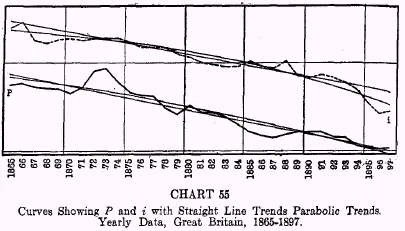
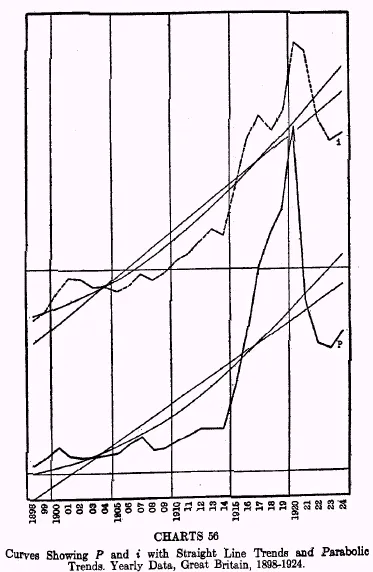
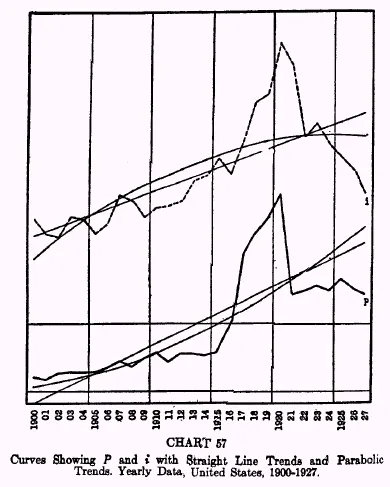
However, to anticipate possible criticisms and errors, the results of eliminating secular trends of prices and interest rates have been studied. These additional studies are also made for another and more important purpose, namely, to discover whether or not the shorter so-called cyclical movements of prices influence long-term interest rates in the same way as the long secular price movements have been shown to do. For simplicity, least square straight line and parabola trends were used. These will answer sufficiently the present purpose. In addition, a cubic trend was applied to the yearly data for the United States for the period 1900 to 1927 and to the British data for the corresponding period.
Charts 54, 55, and 56 show the curves of price levels and interest rates in Great Britain for the period 1820-1924 with straight line trends and parabolic trends plotted, while Chart 57 shows the corresponding curves for the United States for the period 1900-1927.
Edition: current; Page: [433]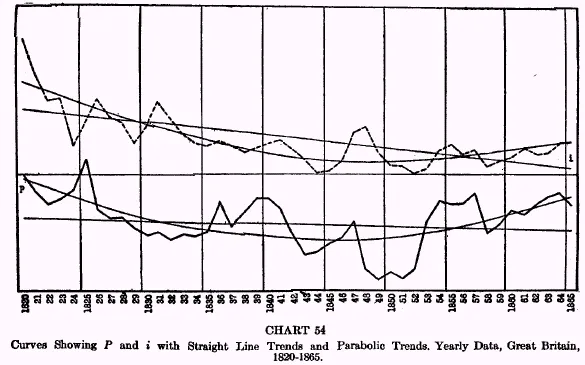
The results, after eliminating these secular trends, are interesting and amazing. The correlation coefficients with straight line trends eliminated are naturally smaller than when these trends are included, but they are still significantly high except for the period 1865-1897 in Great Britain. In the majority of cases, the characteristic lag of about a year of interest rates behind prices gives the highest correlation.
As a further test of the validity of the comparisons, the parabola trend deviations for the recent period, ending with the high point for both P and i in 1920, have been computed and plotted, though the charts are not here shown. It might be supposed that the elimination of a parabolic trend from these violently fluctuating series would leave only erratic wiggles in the P and i curves with little or no correspondence with each other. That price levels and interest rates are very closely related, even when great secular and cyclical forces are eliminated, is clearly demonstrated by the results of these investigations. The correlation coefficients obtained from the data for the period ending in 1920 with the parabolic trends eliminated are about +0.70, which certainly indicates that yearly fluctuations, as well as cyclical and secular trends, of prices and interest are generally in the same direction. The coefficients obtained from correlating P and i with straight line trends eliminated are plotted on Chart 58.
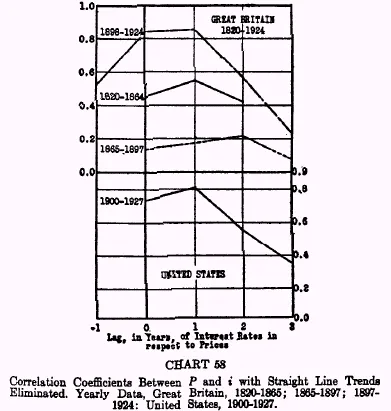
The reader will see that the r's for the latest period are much higher than for the other periods. For Great Britain in the period 1898-1924, r = +0.851 with i lagged one year. For the United States for the corresponding period 1900-1927, and with the same lag of i, we get r = +0.806. It is not worth while to plot the r's Edition: current; Page: [437] with P lagged behind i, since it is apparent at a glance that r decreases with the lagging of P.
When the parabolic trend is eliminated, the correlation coefficients for the cycles become insignificant except for the period including the World War. The highest r for the British data for 1820-1864 is +0.319 when i is lagged one year; for 1865-1897, the highest r is +0.045 with i lagged two years; for 1898-1924, r is +0.829 with no lagging, and +0.817 when i is lagged one year. The Edition: current; Page: [438] United States data give r's of +0.695 without lag, and +0.876 with i lagged one year. Even when a cubic trend is eliminated for 1898-1924 the r's still remain significantly high, namely, without lagging, r = +0.794 and with i lagged one year r = +0.790. For the United States without lagging, r = +0.525 and with i lagged one year r = +0.769.
The elimination of the secular trends from the comparisons makes the relationship of i and P depend solely upon the similarity of fluctuations in the shorter or cyclical periods. Even without Hamlet the play proves to be astonishingly informing and interesting. It is quite definitely demonstrated that, in times of marked price changes, as in the World War period, the effects of price movements are felt rather quickly upon the rates of interest, even in the case of long term bond yields.
The Theory of Interest
Read the whole book online · Book details
Free to read online and to download from this archive.